|
SILO 3.1 (DRAFT)Year 3, Term 1: CommunicationScope and sequence: Flowcharts, MultimodalityFocus: Multimodality |
|
Learning
intention: Students
demonstrate their understanding of STEM concepts using
multimodality which has been customised for different
audiences.
|
|
|
Overview: Term 1 explores
communication as a sub-strand of science inquiry and the
creation of an instruction manual such as a cookbook.
|
|
|
NSW Syllabus
|
Australian Curriculum
|
|
"A student creates written texts
to communicate understanding of scientific and technological
concepts and processes" (ST3-CWT-01).
|
"Students write and create texts
to communicate findings and ideas for identified purposes and
audiences, using scientific vocabulary and digital tools as
appropriate" (AC9S3I06).
|

Introduction to communication
What is science communication?
Science communication is the concept of getting scientific knowledge
across to non-expert audiences, ensuring the information can be
understood by those without background information. By doing this, the
presenter is able to demonstrate their own understanding by teaching
others and can use a variety of different means and media to do so.
Key components of good science communication
To better understand what goes into the effective communication of
scientific concepts, let’s break it down by imagining that we are baking
a cake. The end result (the cake) will be the successful communication
of the science, and every ingredient that goes into the cake will be an
important characteristic of the communication method.
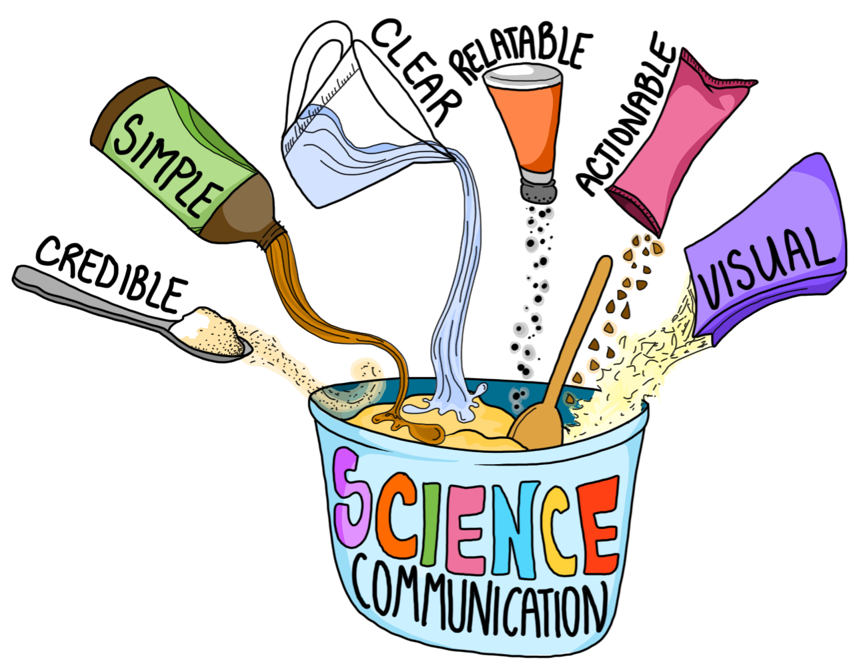
- Is the information I am presenting accurate and credible?
- Is it simple enough that those without a scientific background can understand it?
- Is the message clearly understandable?
- Is it explained in a way that the audience can relate to?
- Can the audience see the actionable, practical value of the information?
- Is it visually understandable to aid in the explanation?
 |
Caterpillars and butterflies |
Your task is to use art as a means of communicating the scientific process that caterpillars follow as they turn into butterflies. Assume the audience (us!) has never heard of this process before. The materials you can use for your art project are:
- Blank paper
- Coloured paper
- Coloured pencils
- Tape
Students have 20 minutes to complete their piece and then present to the class.
Flowcharts
An important idea in this unit is that a flowchart
can be used whether or not an experiment or procedure is carried out.
For example, the logical behind the following flowchart about lamps
makes sense even if you don't have a broken lamp to repair.

(Image source https://en.wikipedia.org/wiki/Flowchart#/media/File:LampFlowchart.svg)
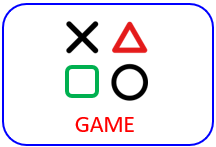 |
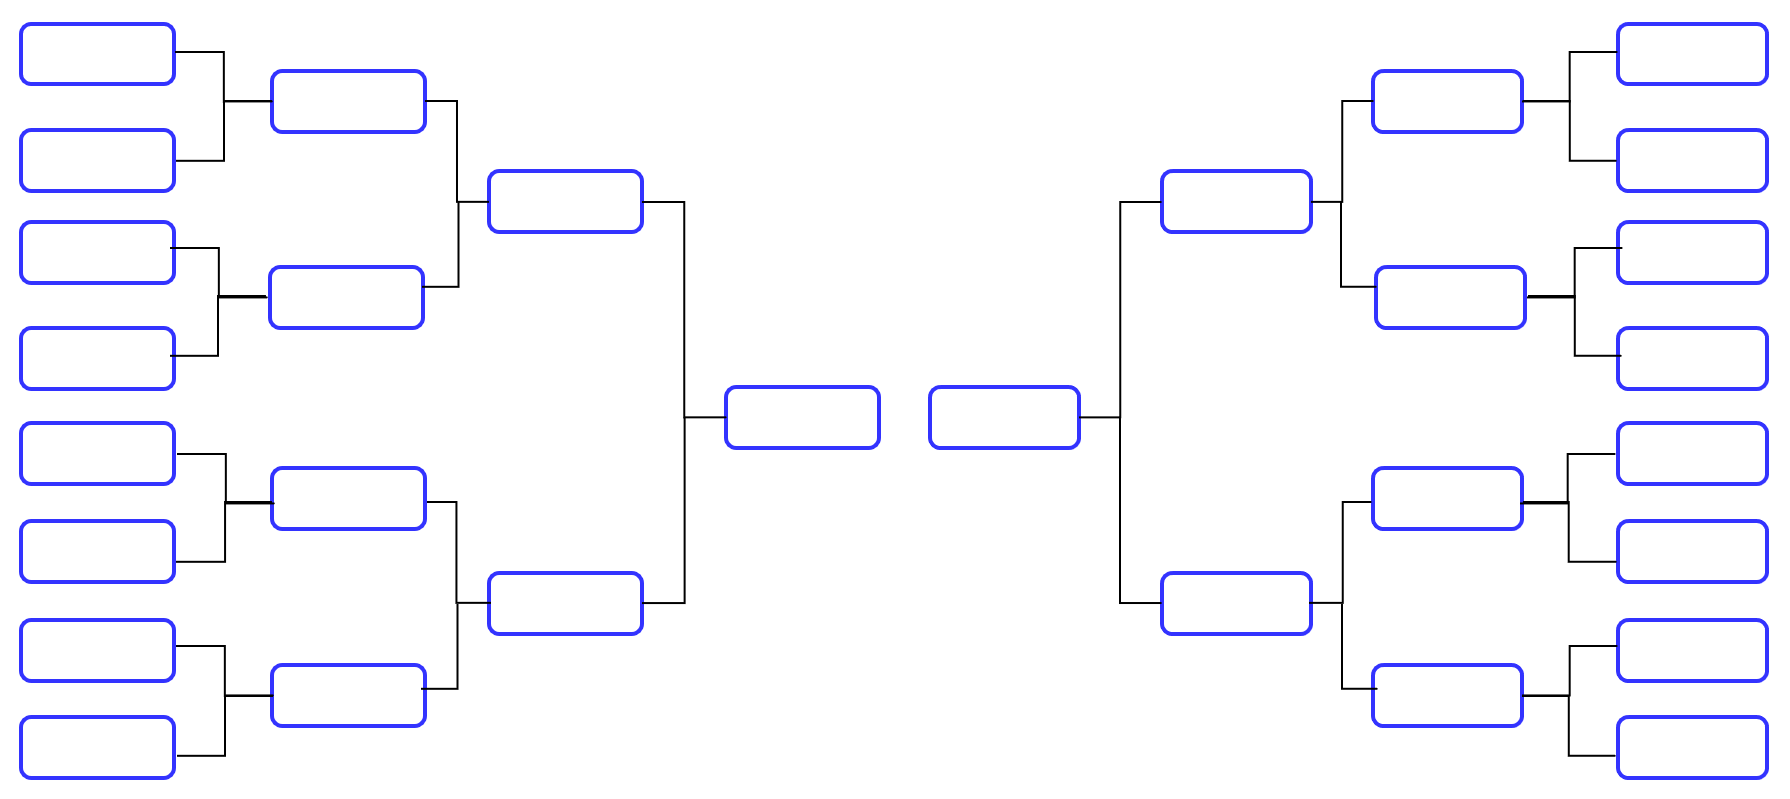
Rock, paper, scissors |
The following chart is for competitions where 16 players are reduced down to 8, 4, 2 and then 1. Your challenge is to come up with ways to incorporate more than 16 players such as 19 or 20. Most classroom have more than 16 students so think of how you could include all students using the same idea of two players competing together. A good context for this activity is the game Rock, paper, scissors.
The following video (2:25) refers to flowcharts as 'flow diagrams' but the concept is the same.
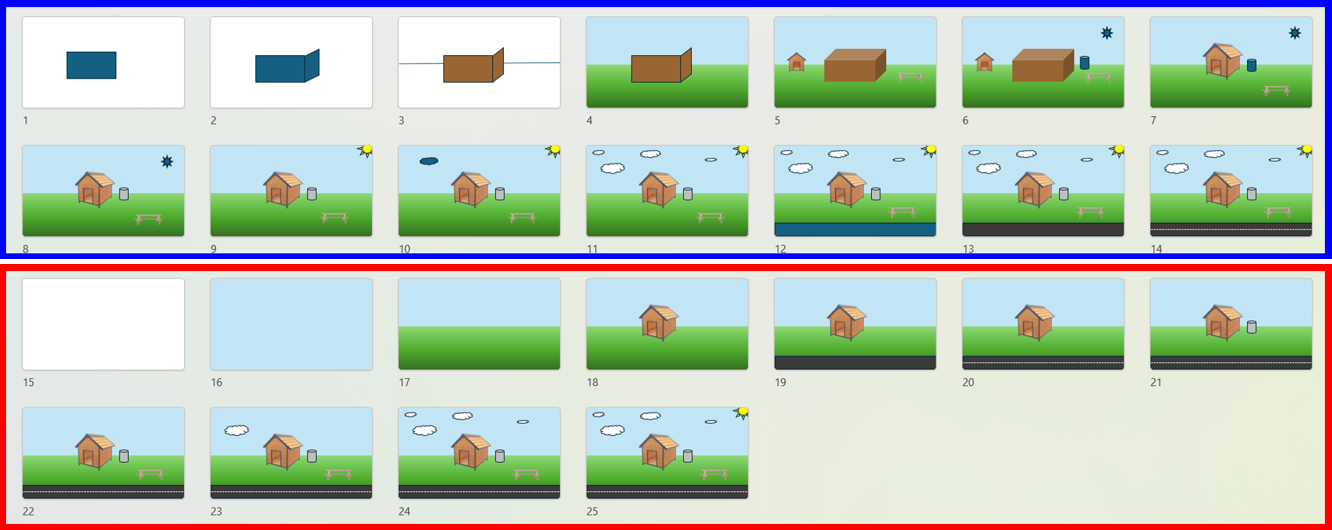
Graphic design
Repetition can be a useful idea and process when working
with graphics. The following image of four robots involved making one
robot and then duplicating it while making some small changes. The
source file for these robots involved working with auto shapes in
PowerPoint. It can be accessed
here.

Creating frame-based animations using Microsoft PowerPoint
Creating frame-based animations in PowerPoint is a simple process based on the functionality of inserting duplicate slides as follows:
- Start a blank presentation and then create imagery by going to the 'Insert' tab and then 'Shapes'.
- Shapes can be edited, copied and added together as an iterative process.
- Create a duplicate slide under 'New slide' and then 'Duplicate selected slide'.
- Make small changes to the new slide.
- Repeat the duplicate slide process as many times as required.
- An efficient way to render the various slides into a video file is to use screen capture to record the advancing frames as an animation.Frames can be advanced automatically through timer settings but advancing the slides manually using the 'Page down' or 'Down arrow' keys enables you to control the frame rate more responsively.
- If a voice-over script is required, we recommend syncing the video to the audio to ensure a relaxed delivery style with perfect synchronisation.
Animations can be made efficiently using Microsoft PowerPoint or Google Slides by inserting duplicate slides and then changing the graphics. Such changes can be to the position, size and/or colour of the imagery. Animation is generally defined as being the illusion of movement created by viewing a succession of images. However, this can be misleading as videos also work by displaying a succession of frames, but videos are often more akin to photography than graphics. Jacobs and Robin (2016) made the following argument for the term 'variant graphics' where the emphasis is on graphics changing, regardless of whether or not there is any movement.
Possibly, a more inclusive term for educational purposes is variant graphics (Jacobs, 2007) where various images are viewed in succession. This term is presented as a description rather than a definition. The reason for using the word variant (i.e., changing) rather than moving is to create a description that can also include slideshows. In a slideshow, there can be movement within a frame or a complete change from one frame to another. Variant covers both scenarios. The term ‘variant graphics’ also affirms that digital storyboards are, in fact, animations (emphasis in original, p. 65).
Using layers in PowerPoint
Each shape which you insert functions as a
layer as it can be selected and manipulated independently of the other
imagery. However, sometimes you will find that one layer is covering
over another, and you might want to rearrange the order of the layers.
To do this, select a layer and then 'Right click' on it. You will be
presented with some options including 'Bring to Front' and 'Send to
Back'. These options allow you to change the order as required.
Grouping and ungrouping images in PowerPoint
When you working with many shapes, it can be very helpful to group multiple shapes together so that they can be moved and resized as a single object. The do this, select the shapes, 'Right click' and then select 'Group' and then 'Group' again. You can also ungroup by selecting 'Group' and then 'Ungroup'. The following challenge gives you an opportunity to practise these skills.
 |
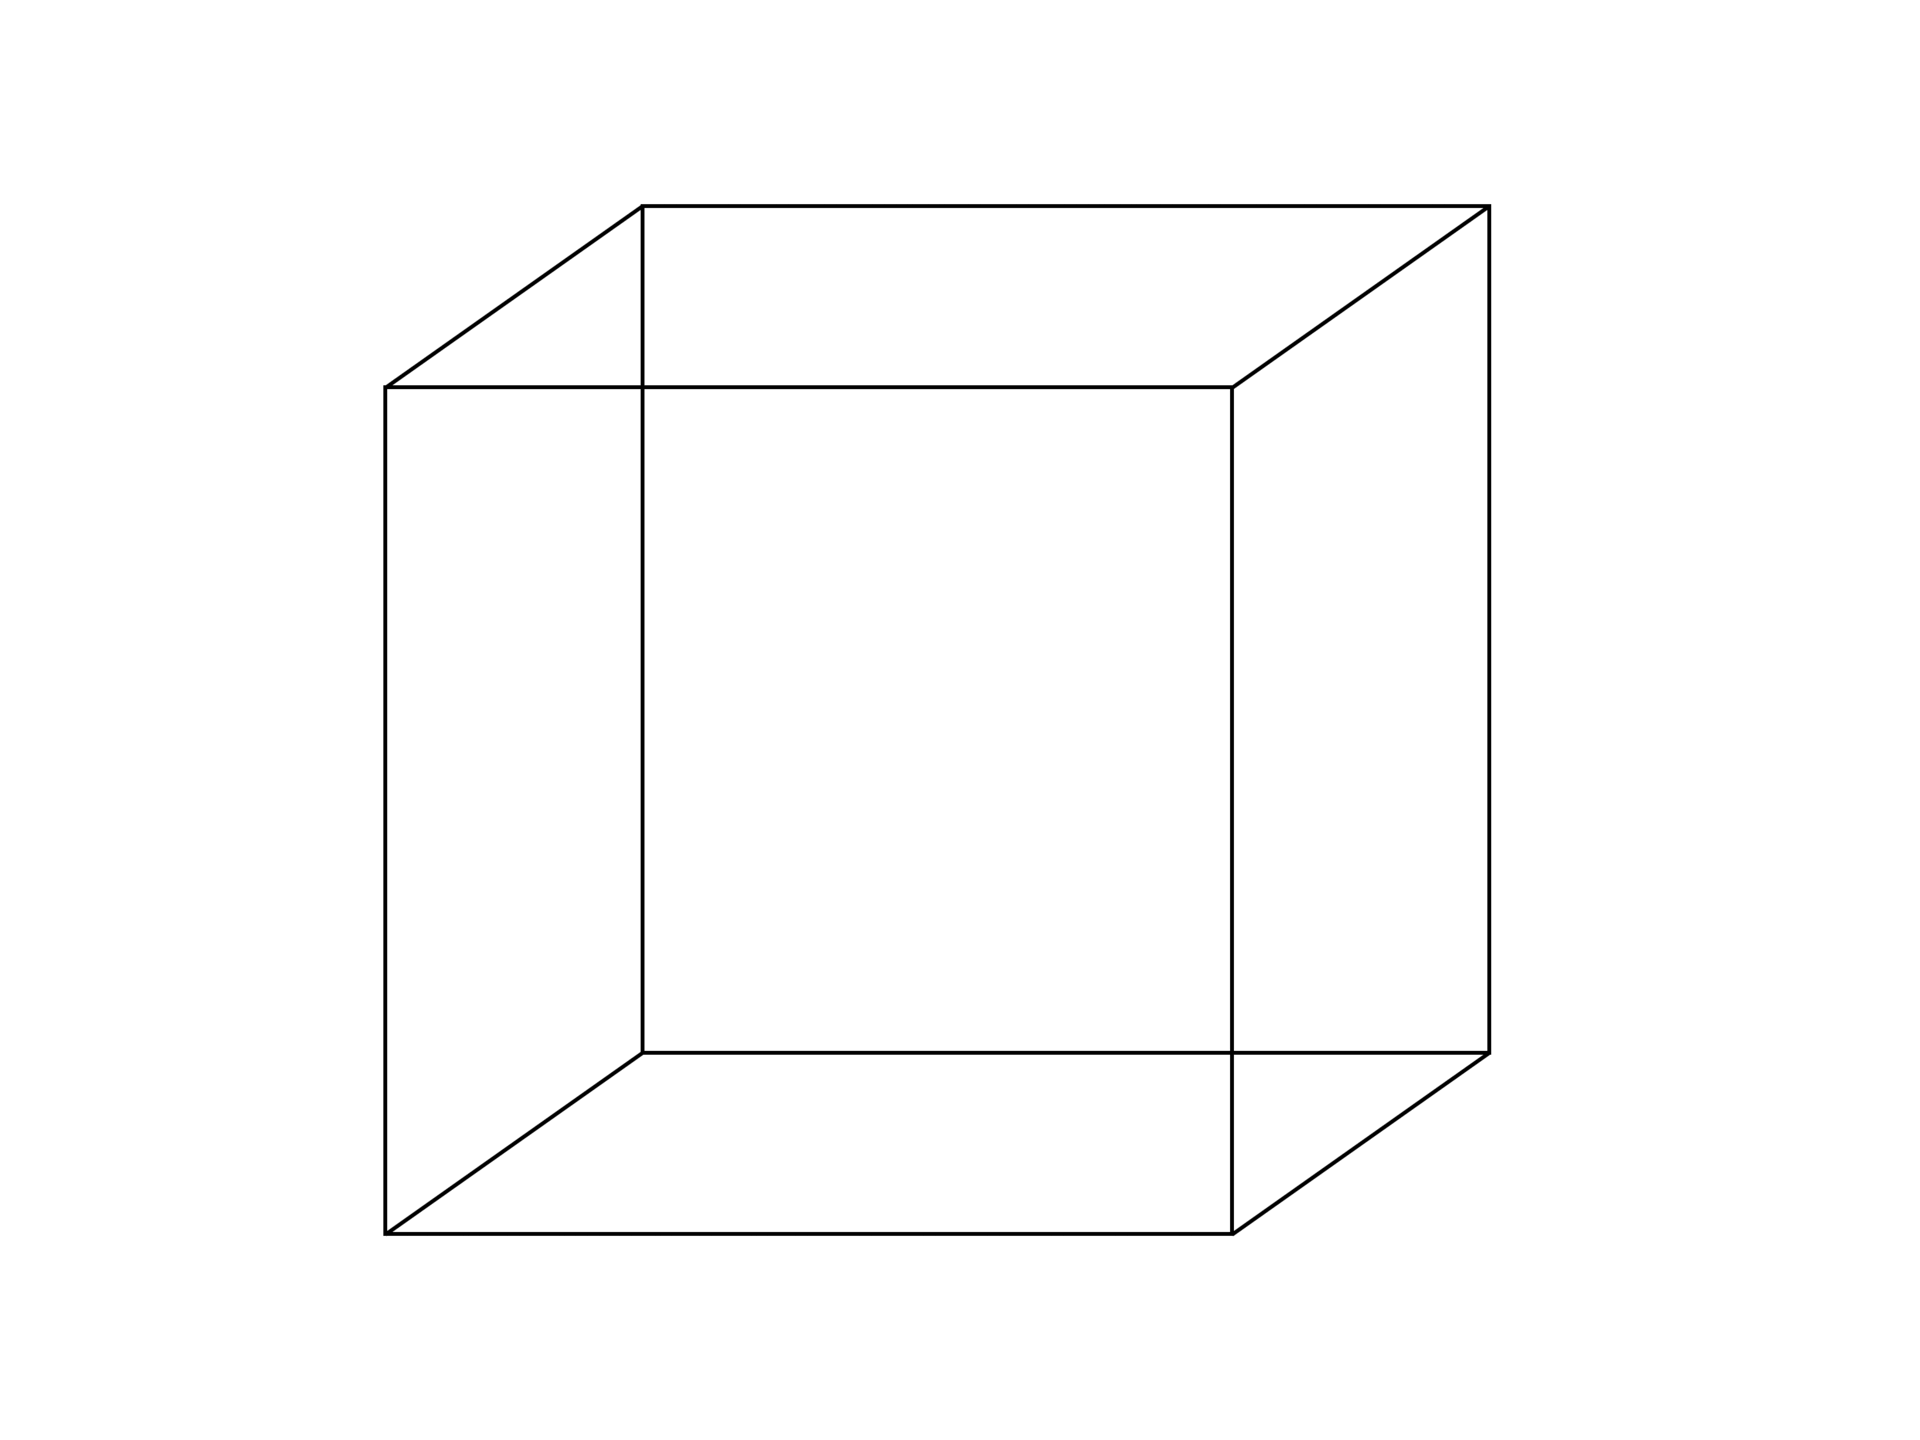
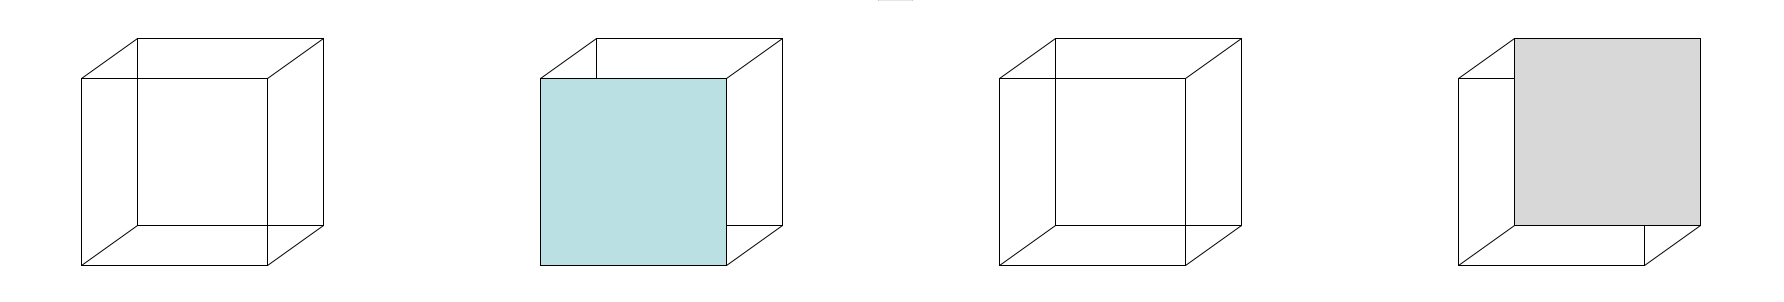
Making a Necker cube |
The Necker cube is an optical illusion first published in 1832 by Louis Albert Necker. It is a simple two-dimensional drawing of a cube with no visual cues as to its orientation. This means that it can be interpreted to have either the lower-left blue face or the upper-right grey face as its front side. Your challenge is to re-create this animation using shapes (i.e., squares) and lines to provide depth. Copy and paste your imagery whenever you can. The advantages of doing this are twofold.
- Copying (and pasting) saves time.
- Copying (and pasting) ensures that objects are identical. This will make your work look more professional as any unwanted variations will be perceived as distractions.
Interactive stories
By creating links using software such as Microsoft PowerPoint or web-based apps like Google Chrome, you can make interactive stories where the user can make choices to determine their own path throughout a story.
- The following example is called The Hollow Stone. Click here to begin your adventure.
- Another example is called The Adventures of Fiona the Fairy Penguin. Click here to begin your adventure.
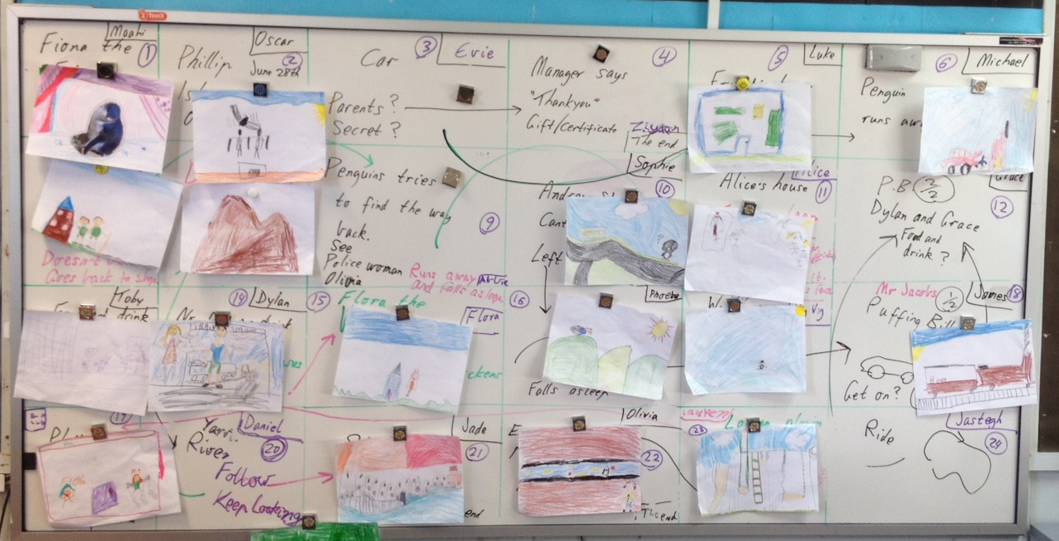
The planning for The Adventures of Fiona
the Fairy Penguin is shown below where each numbered box in the
grid is a separate frame. The arrows show how the various frames connect
with each other.
Reverse-engineering
|
|
Moderated self-assessment
Discussions with students around the key components of conceptual topics and how they fit together can generate insights into student achievement.

We welcome your feedback and suggestions
The chief investigator for The SILO Project is Associate Professor Brendan Jacobs, Head of Department STEM Education, University of New England. The SILO Project thrives on incremental improvement so constructive feedback is greatly appreciated. Please contact Brendan via email at bjacobs7@une.edu.au to share your thoughts and recommendations.

This work is licensed under a Creative Commons Attribution-NonCommercial-ShareAlike 4.0 International License
Main menu